
If you were curious about ingesting Login Events, Query Execution Events, System Activity & Performance Counters, Security Events..or not, I will walk you through the simple process of getting it done. Let’s also remember that there are multiple methods for forwarding logs…..Event Hubs, Cribl, etc, depending on scalability.
 me rn, it’s 1:45AM
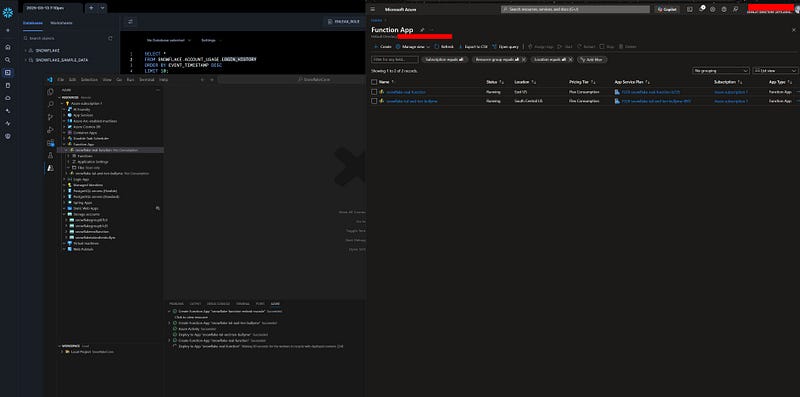
FYSA, I tried to deploy the Funciton App manually before finally deciding on the automated deployment.
Step 1: Create a Log Analytics Workspace
First, make sure your Log Analytics workspace is created. For further instructions, click this embedded link for “Create a Log Analytics workspace.” Now that the first step is complete, you should have a new workspace and resource group.

Let’s attach Sentinel to it by following this guide; “Quickstart: Onboard Microsoft Sentinel.” The first step is complete!

Now that Sentinel is onboarded, we can go ahead and scroll down to data connectors and click “More content at Content Hub” on the top right.
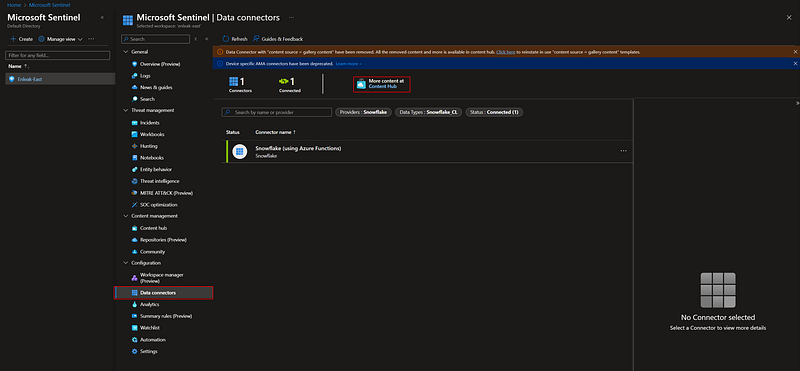
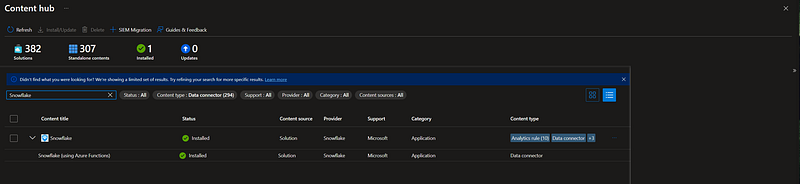
You will install the Snowflake content from this page and include the Snowflake data connector.
Step 2: Creating a User in Snowflake
To query data from Snowflake, you need a user assigned to a role with sufficient privileges and a virtual warehouse cluster; please make sure to note down all the relevant credentials and your “Account Identifier.” The initial cluster size will be set to SMALL, but it can be adjusted as needed. FYSA, you can get 30 days of free access to Snowflake to test with (https://signup.snowflake.com/).
1. Enter the Snowflake Console and Create a Role
Switch to the
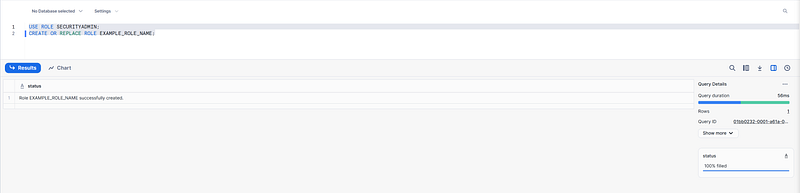
SECURITYADMINrole and create a new role:
USE ROLE SECURITYADMIN;
CREATE OR REPLACE ROLE EXAMPLE_ROLE_NAME;
2. Create a Warehouse and Grant Access
Switch to the
SYSADMINrole, create a warehouse, and grant access to the role:
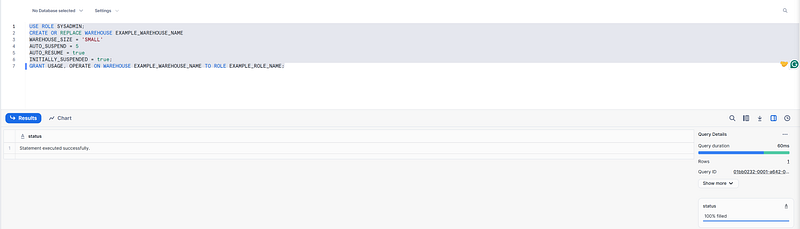
USE ROLE SYSADMIN;
CREATE OR REPLACE WAREHOUSE EXAMPLE_WAREHOUSE_NAME
    WAREHOUSE_SIZE = 'SMALL'
    AUTO_SUSPEND = 5
    AUTO_RESUME = TRUE
    INITIALLY_SUSPENDED = TRUE;

GRANT USAGE, OPERATE ON WAREHOUSE EXAMPLE_WAREHOUSE_NAME TO ROLE EXAMPLE_ROLE_NAME;
3. Create a User
Switch back to the
SECURITYADMINrole and create a new user:
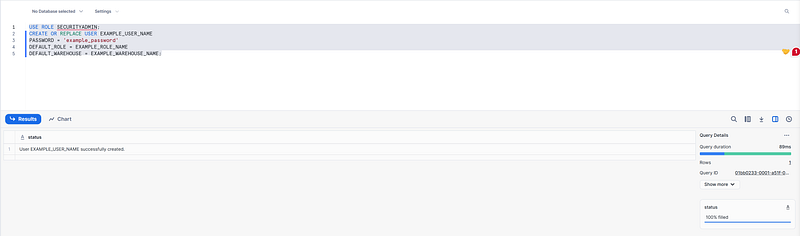
USE ROLE SECURITYADMIN;
CREATE OR REPLACE USER EXAMPLE_USER_NAME
    PASSWORD = 'example_password'
    DEFAULT_ROLE = EXAMPLE_ROLE_NAME
    DEFAULT_WAREHOUSE = EXAMPLE_WAREHOUSE_NAME;
4. Grant Database Access
Switch to the
ACCOUNTADMINrole and grant access to the Snowflake database:
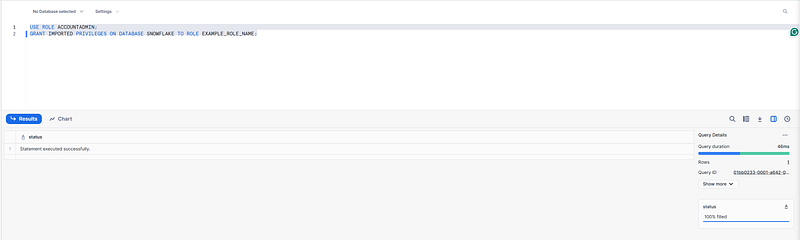
USE ROLE ACCOUNTADMIN;
GRANT IMPORTED PRIVILEGES ON DATABASE SNOWFLAKE TO ROLE EXAMPLE_ROLE_NAME;
5. Assign Role to User
Switch back to the
SECURITYADMINrole and assign the role to the user:
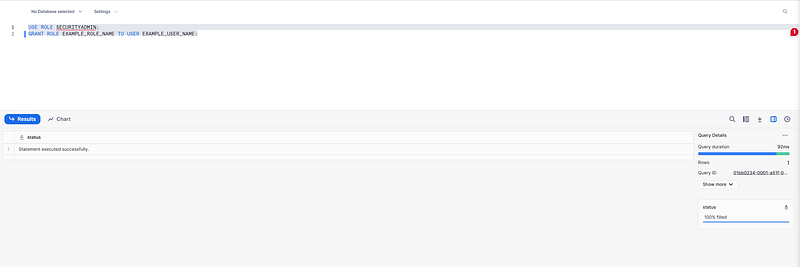
USE ROLE SECURITYADMIN;
GRANT ROLE EXAMPLE_ROLE_NAME TO USER EXAMPLE_USER_NAME;
Step 3: Automated deployment of the data connector using an ARM Template
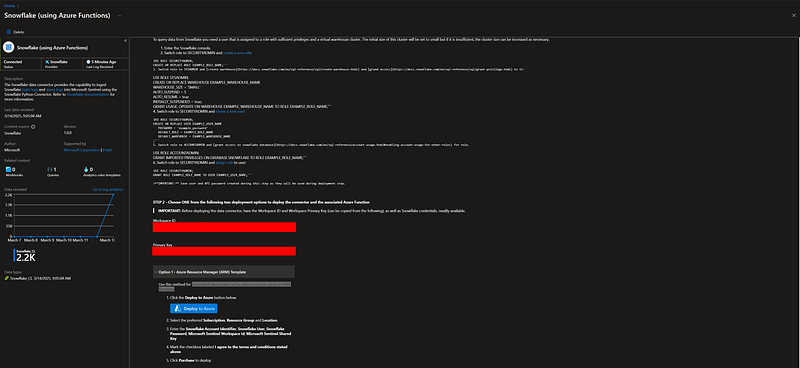
The appropriate page will be found under the connector page.
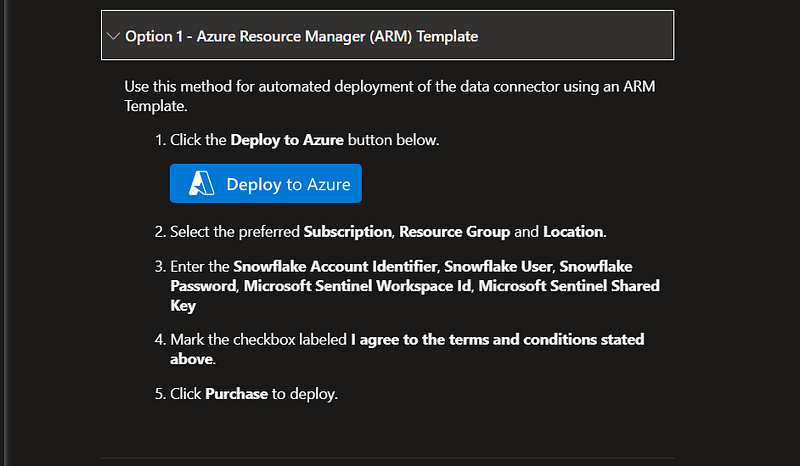
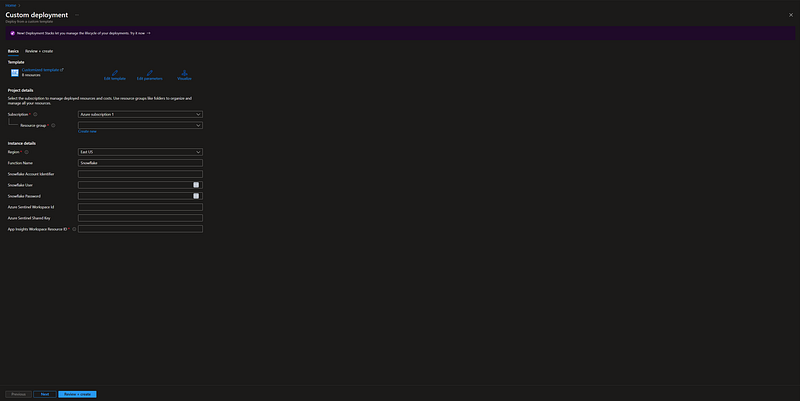
More information on ARM templates can be found in the embedded link. Now that we have clicked “Deploy to Azure,” we will be greeted with the “Custom Deployment” page, which can be seen below. On this page, you are tasked with filling in the necessary information we noted down earlier and clicking “Review + Create” on the bottom left;
Subscription:
Resource group:
Region:
Function Name:
Snowflake Account Identifier:
Snowflake User:
Snowflake Password:
Azure Sentinel Workspace Id:
Azure Sentinel Shared Key:
App Insights Workspace Resource ID:
Step 4: Confirming Function App Configurations
Under “Function App” in Azure, choose the newly created function app and scroll to the “Configuration” option.
What is a function app, you may be asking. Function Apps are serverless applications that run code only when triggered.
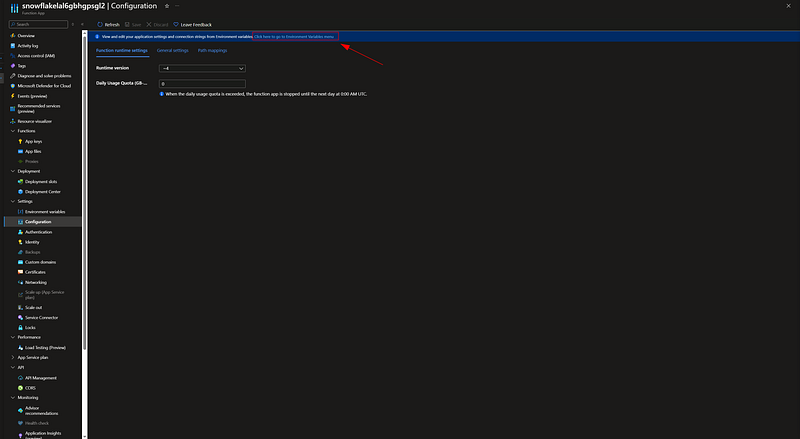
This will take you to the “Environment Variables” tab, where you can view and edit all the variables within the function app:
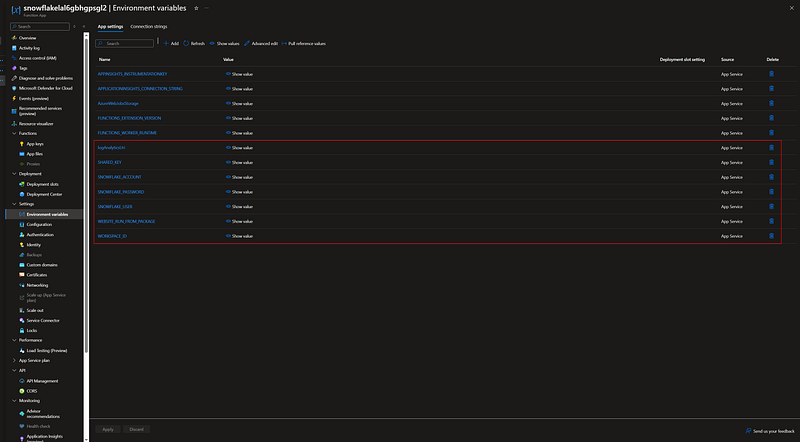
Now that this is complete, you can scroll back up to Overview and click on “Invocations and more” under “Monitor”:
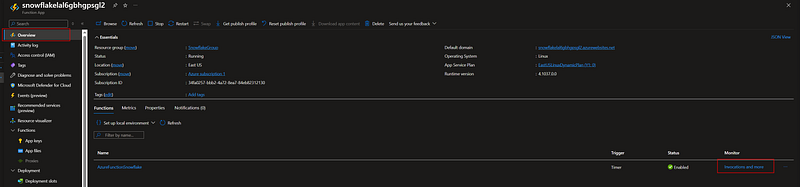
Under “Logs”, you’ll notice that there's a “Connecting to Application Insights…” message before ultimately connecting and displaying a message confirming the ingestion of logs.

Step 5: Confirming Snowflake Connector Status
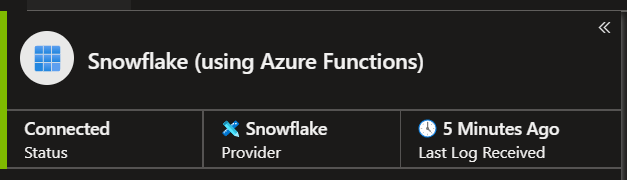
Once you have completed the steps, your connector should show as “Connected,” and Snowflake logs should be coming in.
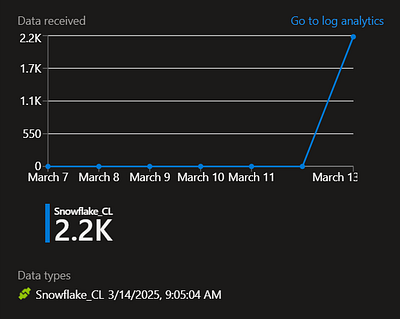
Let’s go check our logs!
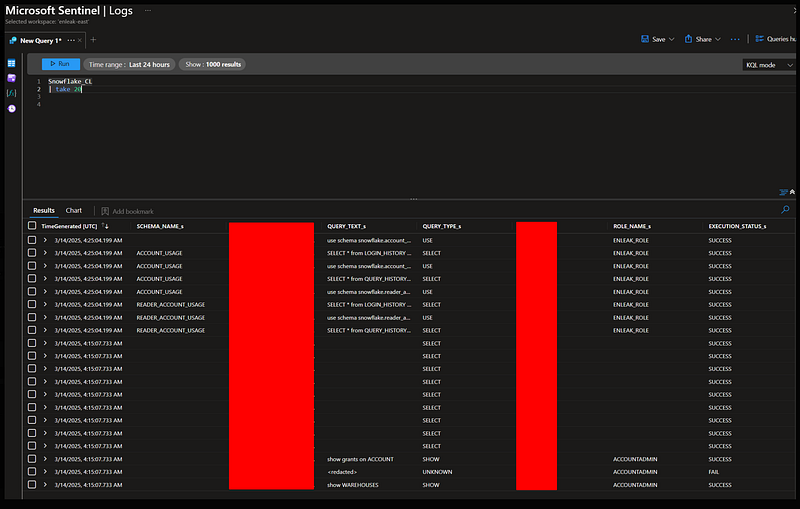
You thought this was where it ended? Wrong. Now that logs are coming into Sentinel, we should create a simple analytic rule to catch possible brute-force attempts.

Step 6: Creating Rule To Detect Possible Bruteforce
Under your Sentinel page, scroll to “Analytics” and click “Create,” where you can choose between scheduled query rules, NRT query rules, or Microsoft incident creation rules.
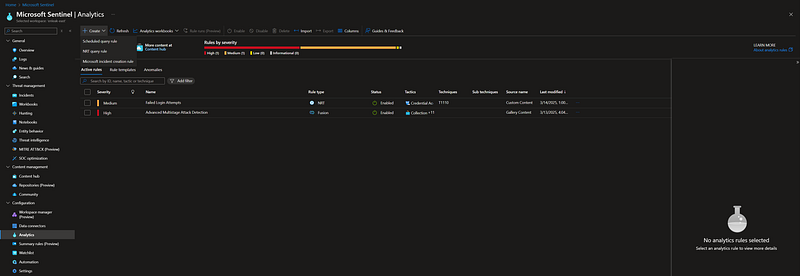
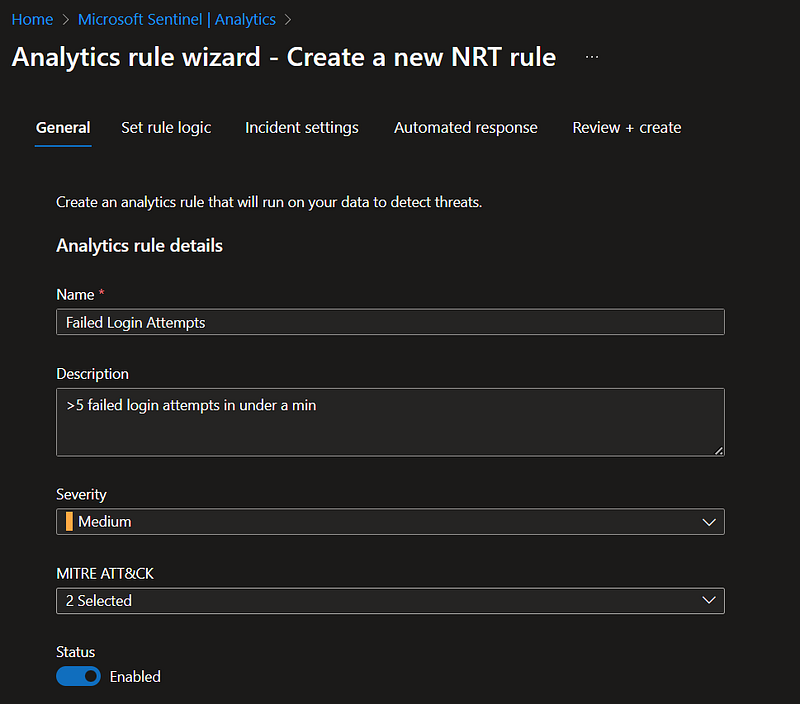
Let's click on “ NRT query rules” and choose an appropriate name, description, severity, and MITRE ATT&CK that are relevant to the detection you're creating.
Click Next, and now we have to define the logic(this query finds users with 3 or more failed login attempts within each one-minute interval, grouping by user and IP address):
Snowflake_CL
| where EVENT_TYPE_s == "LOGIN"
| where IS_SUCCESS_s == "NO"  // Filter failed login attempts
| summarize FailedAttempts = count() by USER_NAME_s, bin(TimeGenerated, 1m), CLIENT_IP_s
| where FailedAttempts >= 3
| project TimeGenerated, USER_NAME_s, CLIENT_IP_s, FailedAttempts
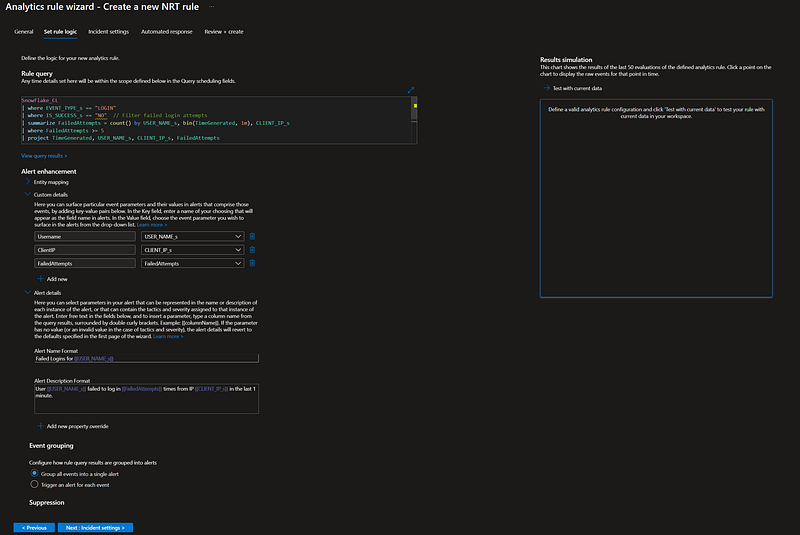
Ultimately, you click “Review & Create” after tweaking any settings under “Incident Settings” and “Automated Response”. You should now have a new NRT rule created!


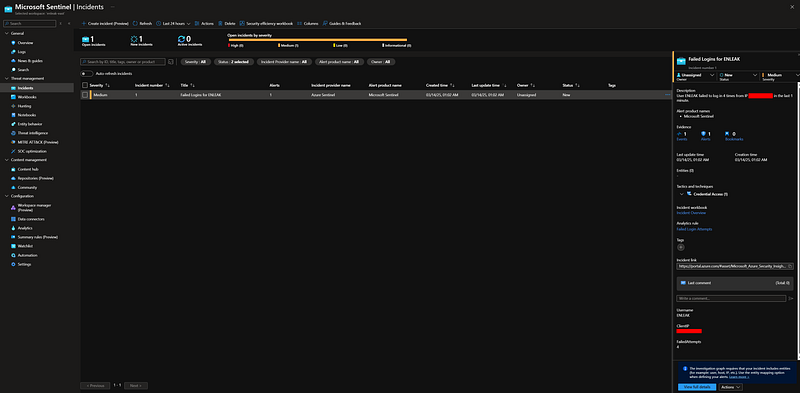
Finally, let’s try to lock our user from Snowflake in an attempt to trigger this alert. After locking ourselves out, we receive an alert in the queue for “Failed Logins for ENLEAK”?!
Thank you for reading. Have a nice day :).