The host telemetry I knew best came from Windows. Sysmon and the Windows Event Log gave me familiar places to trace process activity. When I started looking more closely at macOS, I realized I could read the events surfaced by an EDR without really knowing how macOS produced them.
I wanted to fill in that gap, which led me to Apple's Endpoint Security Framework (ESF).
In this post, we'll look at why Apple introduced ESF, inspect the event stream with Mac Monitor, and use a controlled test to reconstruct activity from the operating system's perspective.
Before ESF: Kernel Extensions
Before the Endpoint Security Framework existed, security products still needed a way to observe what was happening on macOS. If you wanted to detect process executions, monitor file activity, or enforce security decisions, you needed visibility into the operating system itself.
One of the primary solutions was kernel extensions, or KEXTs. A KEXT is a loadable module that extends the functionality of the macOS kernel, allowing third-party software to interact directly with the operating system at a very low level.
For security vendors, this level of access was incredibly powerful. Running inside the kernel meant they could observe system activity as it happened and, in many cases, intervene before an operation completed.
The downside was that every KEXT became part of the kernel itself. If a kernel extension contained a bug, leaked memory, or crashed, it had the potential to destabilize the entire operating system. As more security products relied on KEXTs, Apple began looking for a safer and more maintainable architecture that could provide the same visibility without requiring third-party code to run inside the kernel.
Enter the Endpoint Security Framework
With macOS Catalina (10.15), Apple introduced the Endpoint Security Framework (ESF) as the modern interface for endpoint security products. ESF gives authorized clients access to security-relevant system events without placing third-party monitoring logic inside the kernel.
Clients subscribe only to the event types they need. Notification events report activity, while authorization events allow a client to approve or deny an operation before it completes. Apple demonstrates that model in Build an Endpoint Security app, its WWDC20 introduction to building an ESF client.
A familiar example of an ESF client is the Falcon sensor for macOS. When CrowdStrike announced support for Catalina and Big Sur in 2020, it explained that Falcon used Apple's Endpoint Security Framework to provide visibility, detection, and protection from user space. Access to ESF is restricted: a client needs an entitlement from Apple and approval through macOS privacy controls.
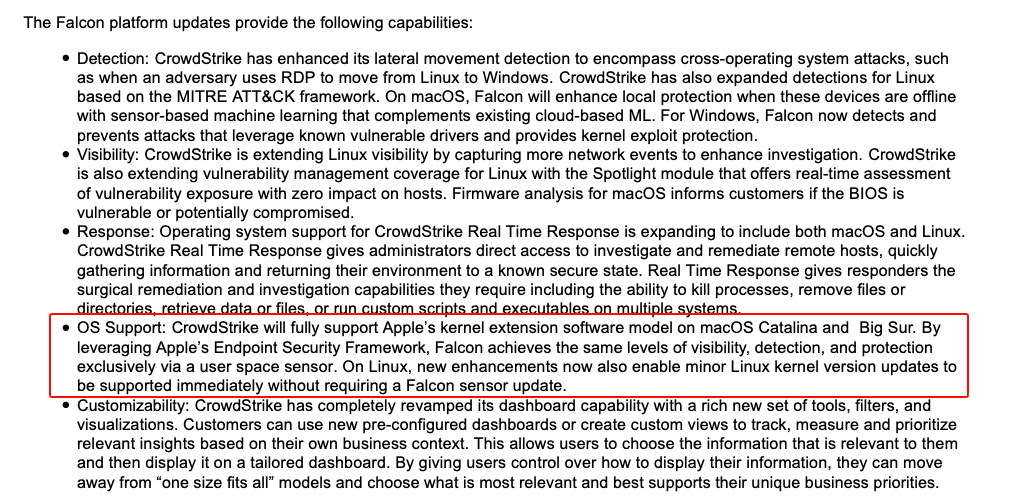
Read the full CrowdStrike announcement.
The result is a supported interface for the visibility endpoint products need, with macOS retaining control of the underlying telemetry and enforcement path.
The Event Vocabulary
Mac Monitor displays the same full ES_EVENT_TYPE_* constants used in Apple's documentation. An AUTH event arrives before an action and can be allowed or denied. A NOTIFY event reports what happened.
These are the events most relevant to our test:
| Action | Apple event constant | Description |
|---|---|---|
EXEC | ES_EVENT_TYPE_AUTH_EXEC / ES_EVENT_TYPE_NOTIFY_EXEC | A process is executing an image. |
FORK | ES_EVENT_TYPE_NOTIFY_FORK | A process has forked a child process. |
EXIT | ES_EVENT_TYPE_NOTIFY_EXIT | A process has exited. |
CREATE | ES_EVENT_TYPE_AUTH_CREATE / ES_EVENT_TYPE_NOTIFY_CREATE | A process is creating a file. |
RENAME | ES_EVENT_TYPE_AUTH_RENAME / ES_EVENT_TYPE_NOTIFY_RENAME | A process is renaming a file. |
UNLINK | ES_EVENT_TYPE_AUTH_UNLINK / ES_EVENT_TYPE_NOTIFY_UNLINK | A process is deleting a file. |
OPEN | ES_EVENT_TYPE_AUTH_OPEN / ES_EVENT_TYPE_NOTIFY_OPEN | A process is opening a file. |
WRITE | ES_EVENT_TYPE_NOTIFY_WRITE | A process has written to a file. |
CLOSE | ES_EVENT_TYPE_NOTIFY_CLOSE | A process has closed a file. |
The descriptions above follow Apple's definitions. Apple maintains a complete reference for Endpoint Security event types.
A Stream, Not a Historical Log
This is where ESF differs from the log sources investigators may be used to working with.
Endpoint Security delivers events to subscribed clients, but the API is not a historical database. A client has to receive and store the events if we want to examine them later.
An EDR sensor may subscribe to selected events, add context, and send the results to its backend. Mac Monitor records the events it receives during a trace. Apple's built-in eslogger utility can subscribe to notification events and output them as JSON. In What's new in Endpoint Security, Apple demonstrates sending that output to a file and explains that it can also be sent to Unified Logging.
That makes ESF especially useful when an incident is ongoing, during a threat hunt, or inside a malware-analysis environment where we can observe behavior as it occurs. For a retrospective investigation, ESF complements persistent sources such as the Apple Unified Log and FSEvents rather than replacing them.
This distinction was emphasized by Jacob Latonis and Julia Paluch in their SANS DFIR Summit 2025 presentation, “macOS Endpoint Security Framework: Not Another macOS Log Source”.
Watching ESF in Action with Mac Monitor
Reading about ESF is one thing. Watching it in action is another.
To see these events for ourselves, we'll use Mac Monitor, an open-source utility created by Brandon Dalton. Brandon currently works in macOS research at CrowdStrike, but Mac Monitor is a standalone open-source project. You can install it with Homebrew or download it from the project's releases page.
Instead of relying on an EDR to summarize activity for us, Mac Monitor lets us inspect and filter the Endpoint Security events generated during our test.
The first time I opened Mac Monitor, I honestly had no idea what I was looking at. EXEC, FORK, EXIT, RENAME, and XPC_CONNECT events were flying by during normal system activity. It quickly became clear how noisy the stream could become without a focused question or filter.
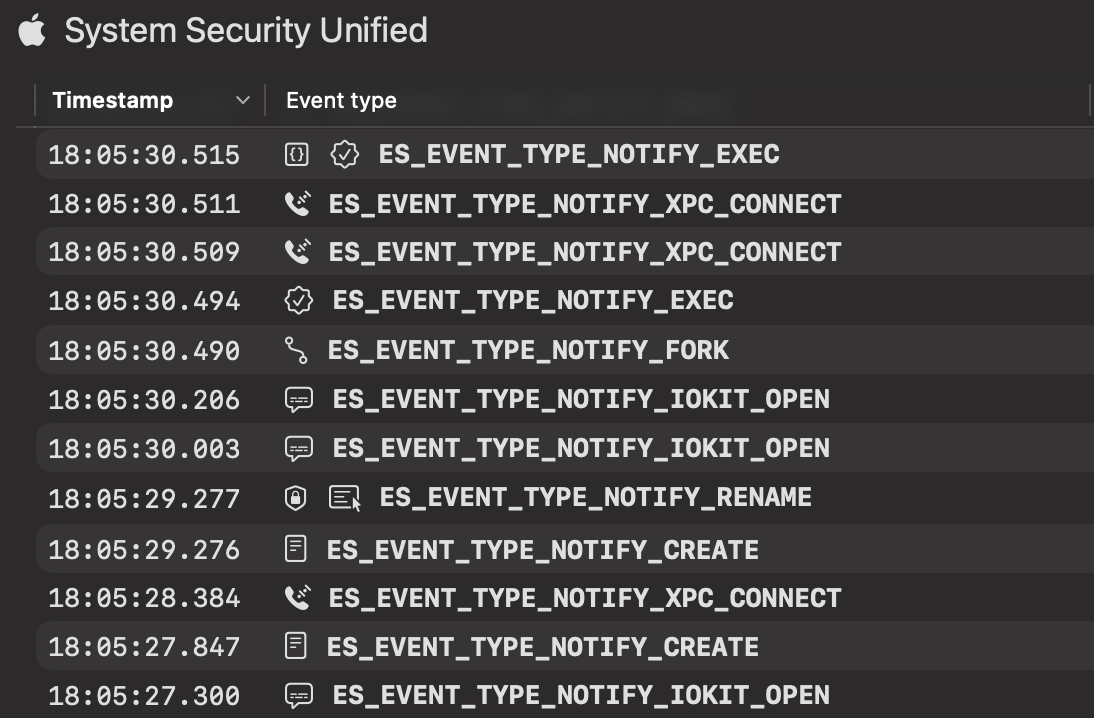
Rather than trying to understand every event at once, we'll keep things simple. In the next section, we'll execute a small test program and use Mac Monitor to answer a few basic questions:
- Which processes executed?
- Which child processes were created?
- What files were created or modified?
- Can we reconstruct the entire sequence of events using only ESF telemetry?
These are familiar investigative questions, but this time we'll answer them directly from the operating system's event stream.
Another Capture Option: eslogger
Mac Monitor gives us a convenient interface for exploring the event stream, but it isn't the only way to capture ESF telemetry. Apple includes eslogger with macOS Ventura and later. It subscribes to the notification events we name and writes their data as JSON:
sudo eslogger exec fork create rename unlink exit > esf-events.jsonl
Run the command before the test, stop it with Control-C afterward, and inspect the JSON Lines output with the tool of your choice. eslogger must run as root, and the responsible process, such as Terminal, needs Full Disk Access. Apple positions it as an analysis and prototyping utility rather than an interface for production applications. The WWDC22 Endpoint Security session demonstrates the workflow and explains those constraints.
Generating Our Own Telemetry
Up to this point, we've talked about how ESF works conceptually. Now it's time to generate our own telemetry and watch macOS report each step.
To keep the experiment focused, I wrote a small Bash script that creates a directory and a file, writes to the file, renames and reads it, then deletes the files and removes the directory. It also collects basic system information and lists the working directory, giving us a few more process executions to follow. Nothing here is malicious. The goal is to generate predictable operating system activity that we can reconstruct afterward.
#!/bin/bash

set -u

LAB_DIR="/tmp/mac-monitor-demo-$$"
FIRST_FILE="$LAB_DIR/esf-original.txt"
RENAMED_FILE="$LAB_DIR/esf-renamed.txt"
SYSTEM_FILE="$LAB_DIR/esf-system-info.txt"

echo "[+] Starting Mac Monitor ESF test"
echo "[+] Script PID: $$"
echo "[+] Parent PID: $PPID"

sleep 2
mkdir "$LAB_DIR"
sleep 2
/usr/bin/touch "$FIRST_FILE"
sleep 2
/bin/echo "Mac Monitor ESF demonstration" > "$FIRST_FILE"
sleep 2
mv "$FIRST_FILE" "$RENAMED_FILE"
sleep 2
cat "$RENAMED_FILE"
sleep 2
uname -a > "$SYSTEM_FILE"
sleep 2
ls -la "$LAB_DIR"
sleep 2
rm "$RENAMED_FILE"
rm "$SYSTEM_FILE"
sleep 2
rmdir "$LAB_DIR"

echo "[+] Test complete"
I started Mac Monitor before executing the script so it was already subscribed when the first event arrived. The pauses in the script spread the activity out just enough to make it easier to follow live.
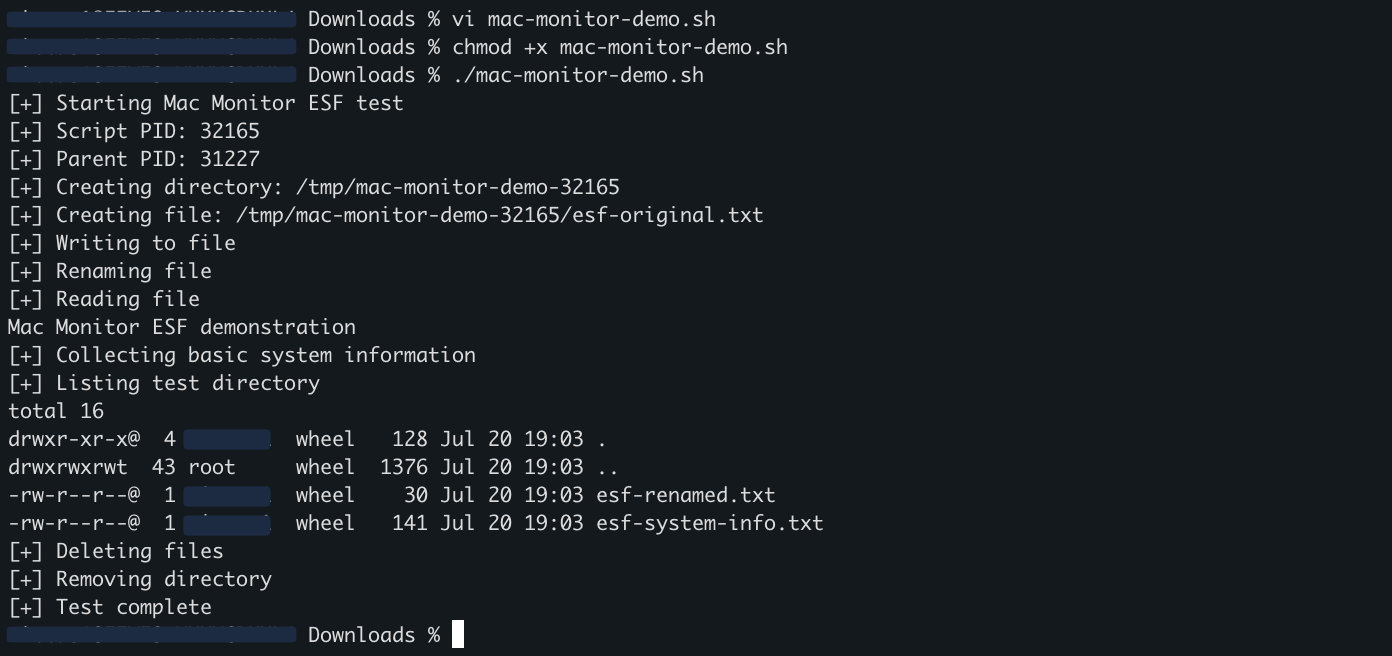
Even this short sequence produced a surprisingly rich stream of telemetry. A single line in the script could produce a FORK, an EXEC, the filesystem event we expected, and an EXIT. Across the run, Mac Monitor recorded events including EXEC, FORK, CREATE, RENAME, UNLINK, and EXIT.
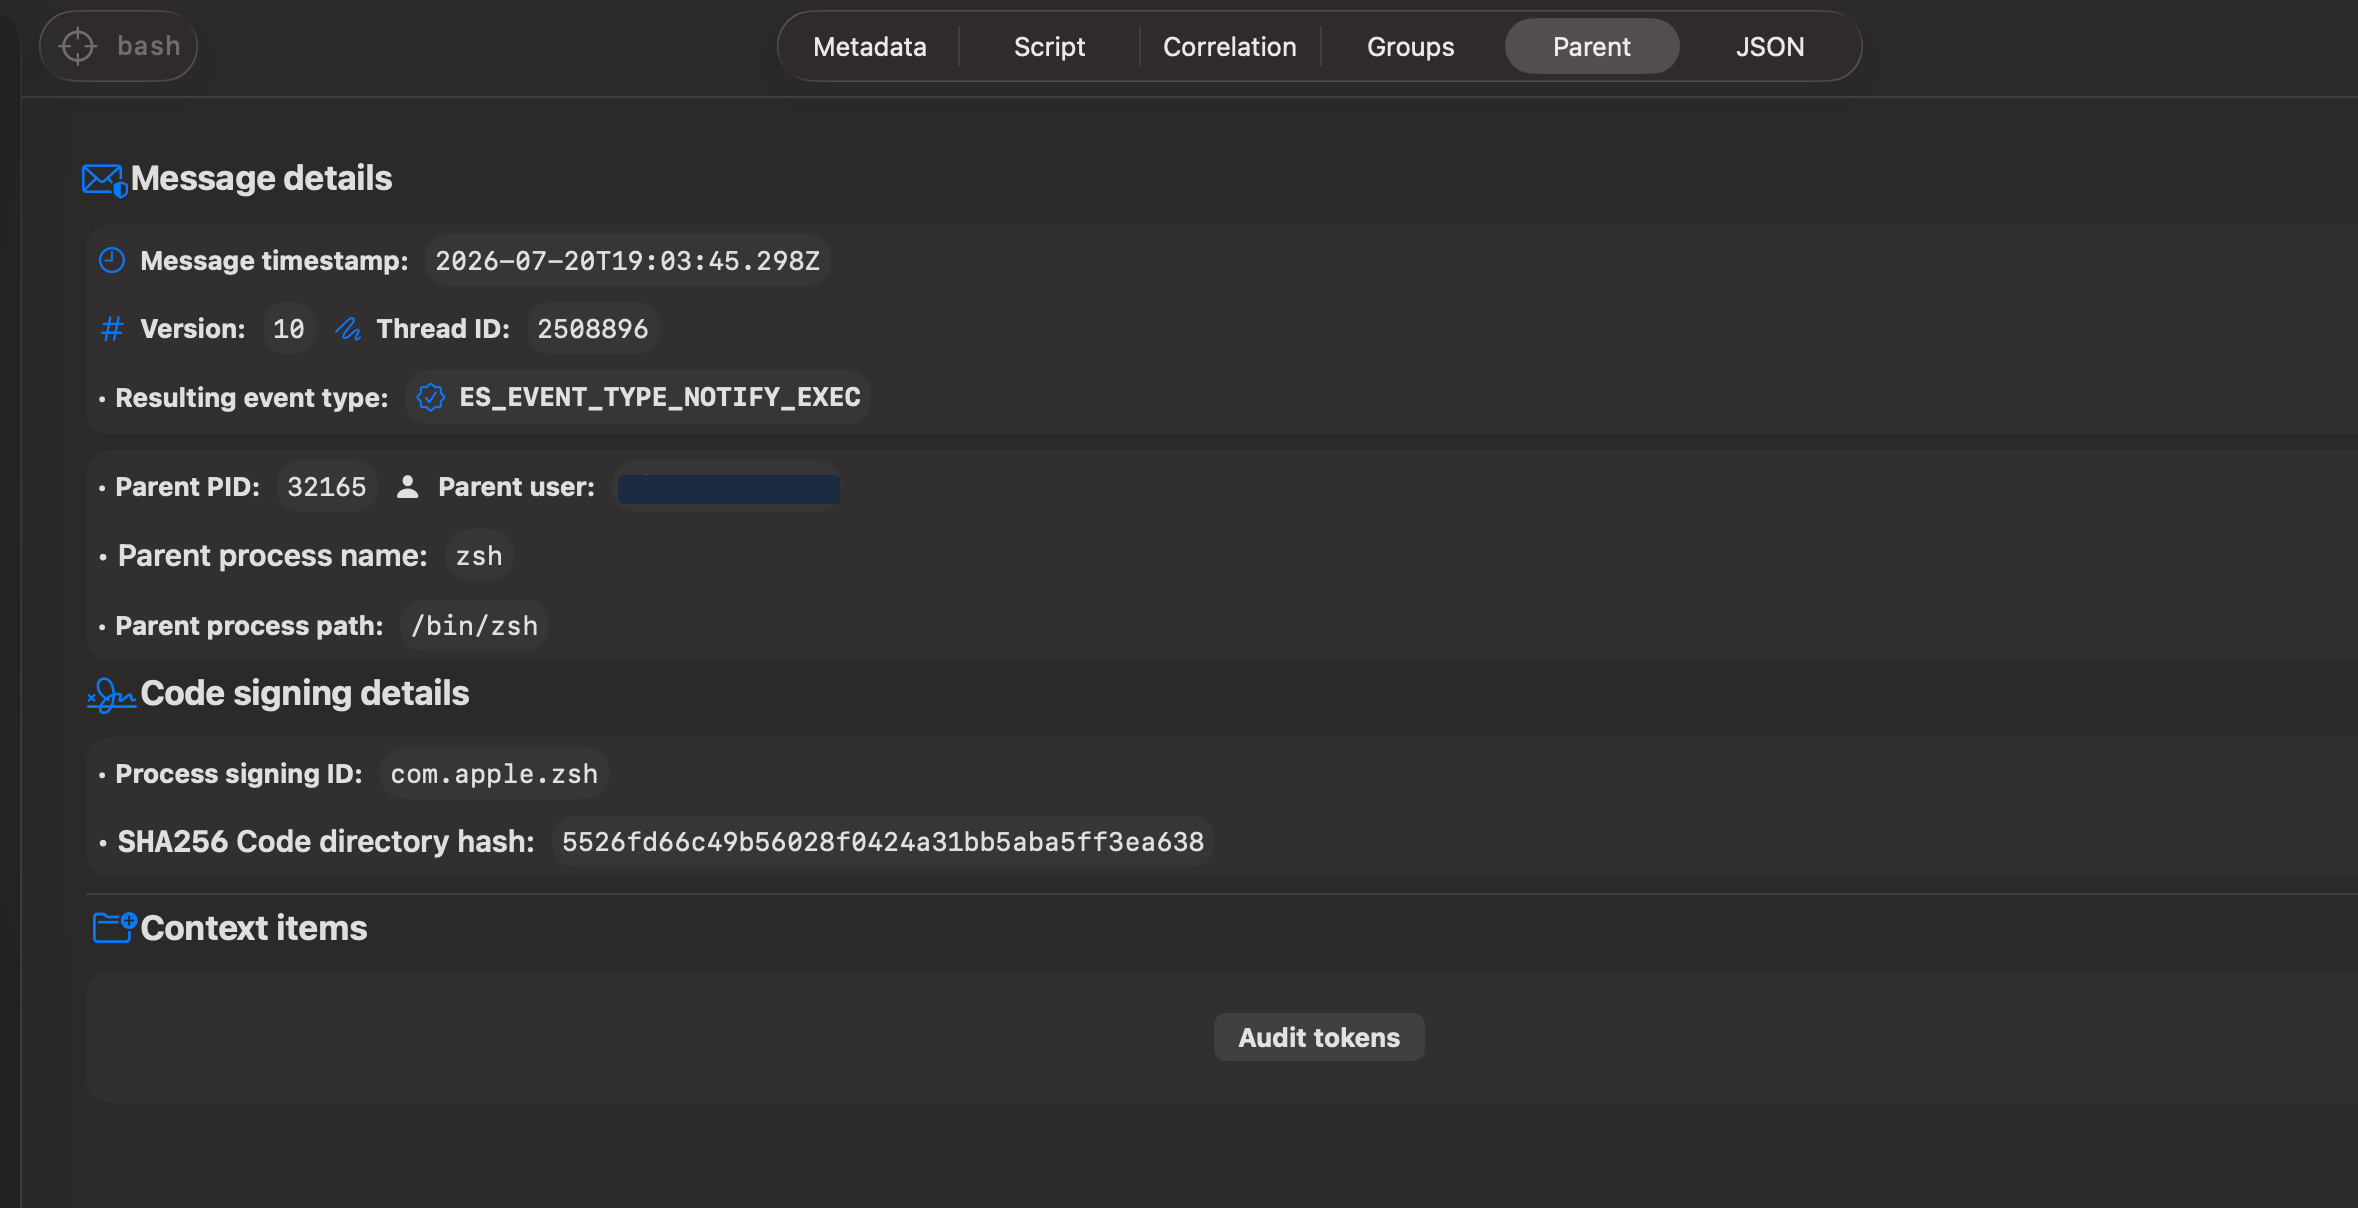
Opening the script's initial EXEC event shows how much context ESF makes available. Alongside the event type, Mac Monitor exposes the executable, command line, resolved script path, current working directory, terminal, audit-token values, and code-signing details.
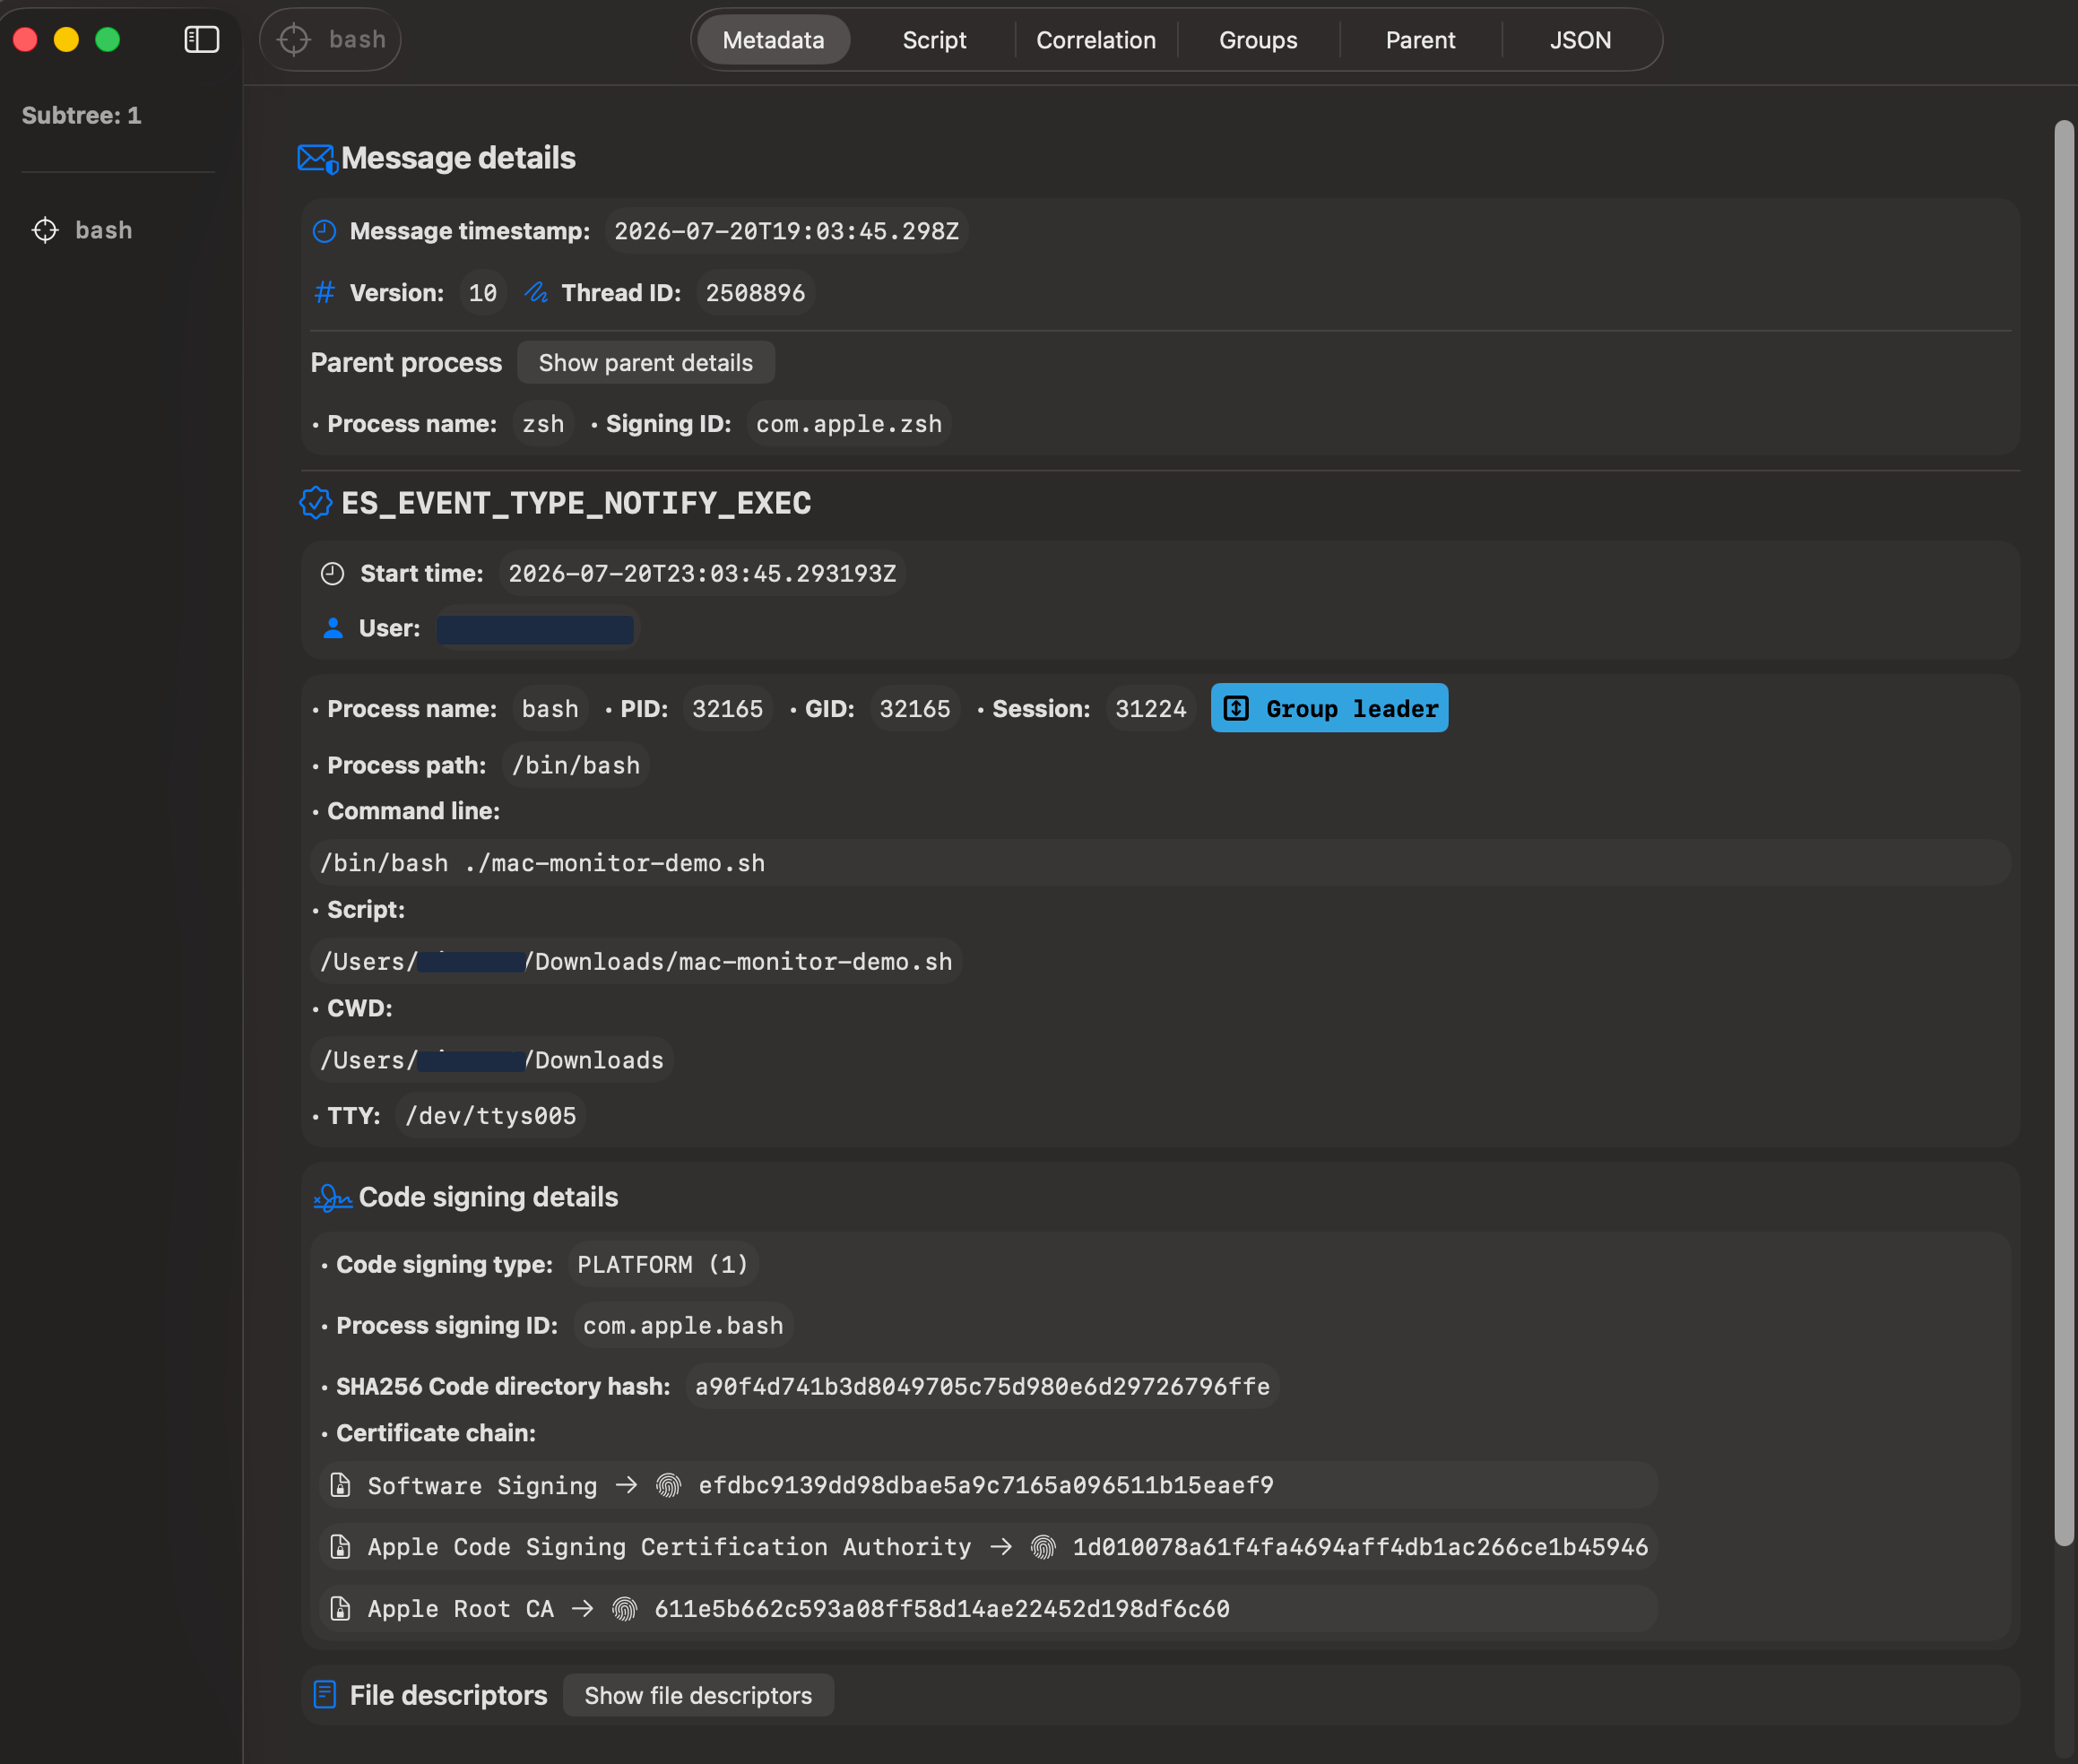
The parent view identifies the zsh process that launched Bash and ties the script back to the terminal session.
Turning the Event Stream into a Timeline
The raw ESF JSON is extremely detailed, but it isn't pleasant to read as an investigation timeline. The export also contained unrelated background activity captured while the test was running.
To narrow the view, I had an LLM write a small Python parser. I gave it the export format and the result I wanted: find mac-monitor-demo.sh, identify the script's root PID, follow its descendants, keep only the event types relevant to the experiment, and sort them into a Markdown table. I reviewed the output against the raw events before using it here.
python3 parse_esf_timeline.py exec.json \
  --root-match 'mac-monitor-demo\.sh' \
  --output esf-timeline.md

The cleaned timeline makes the sequence visible without stripping away the relationships that matter. We can follow Bash creating child processes, see those children execute utilities such as mkdir, touch, mv, and cat, and then connect their filesystem operations and exit events back to the original script.
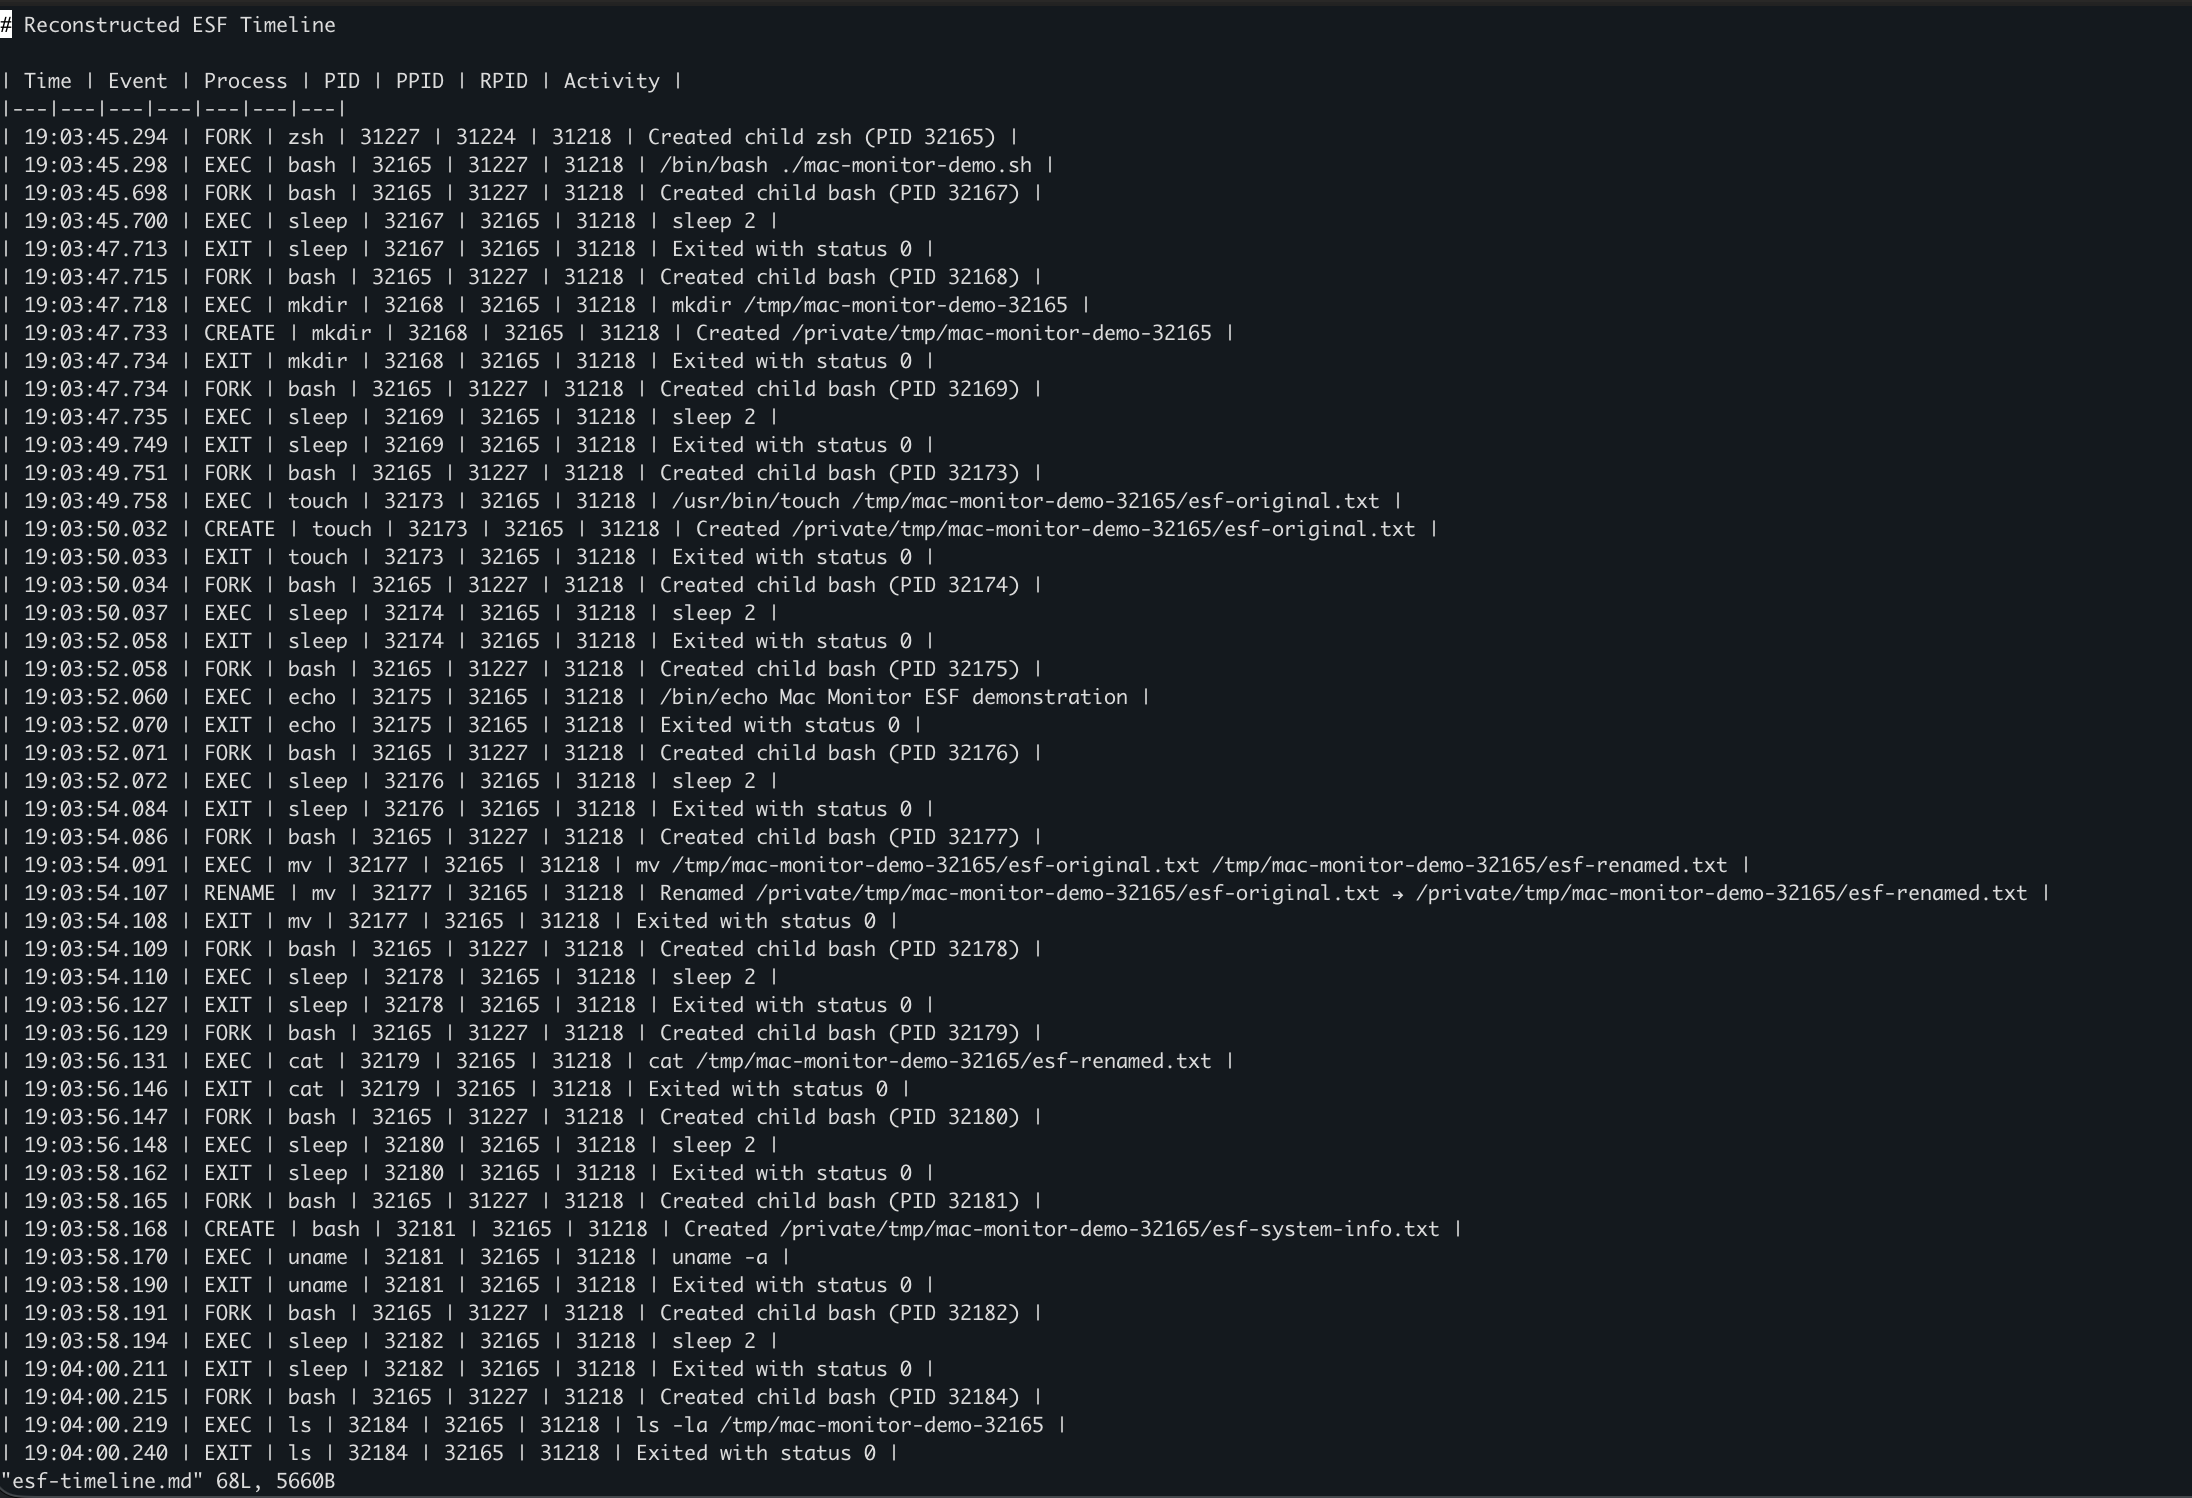
Now that the background noise is out of the way, we can walk through the complete chain and compare the script we ran with the events macOS actually reported.